BTC Trend Filter System · Daily Timeframe · Pine Script
Stop riding every crash. Trade with the trend.
A rules-based BTC strategy using a 7-indicator voting system. Stress-tested across 2020–present
— through bull runs, crashes, and bear markets. Not a black box.
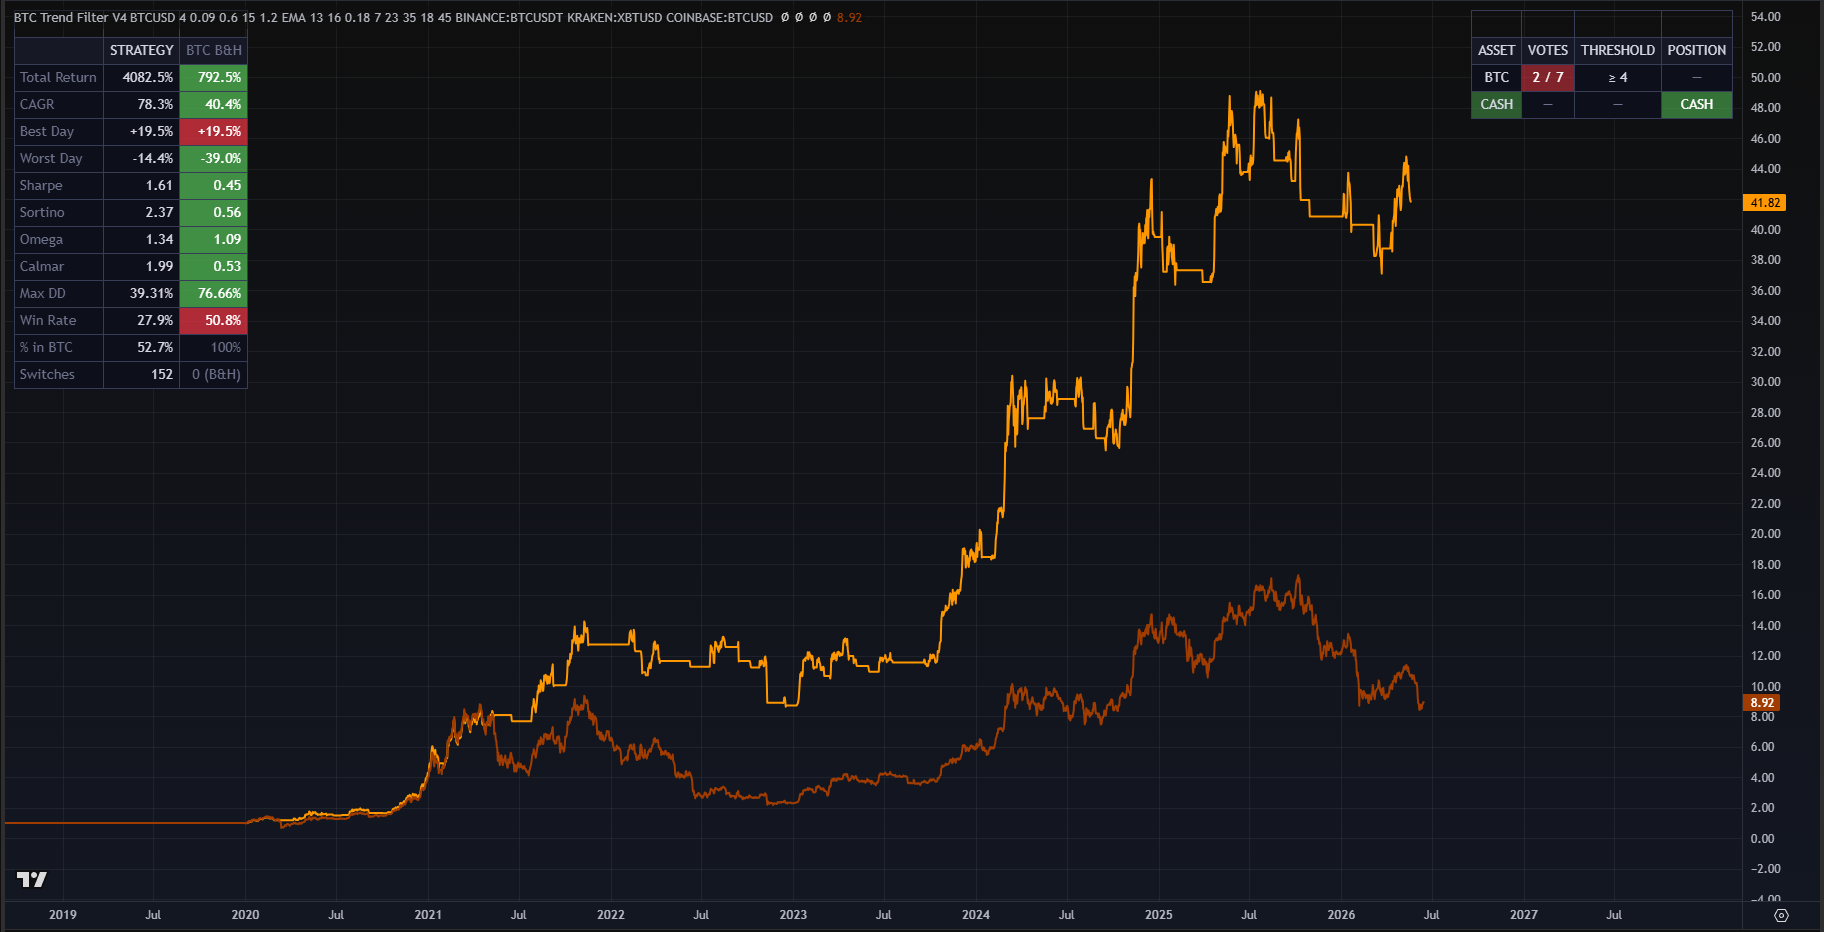
Every number in this report is derived from a full backtest across Jan 2020 to present — covering the COVID crash,
the 2021 bull run, the 2022 bear market, and the 2024 ATH cycle. The full robustness report is included with your subscription.
Equity curve — strategy vs BTC buy-and-hold. Orange = in BTC, green = cash.
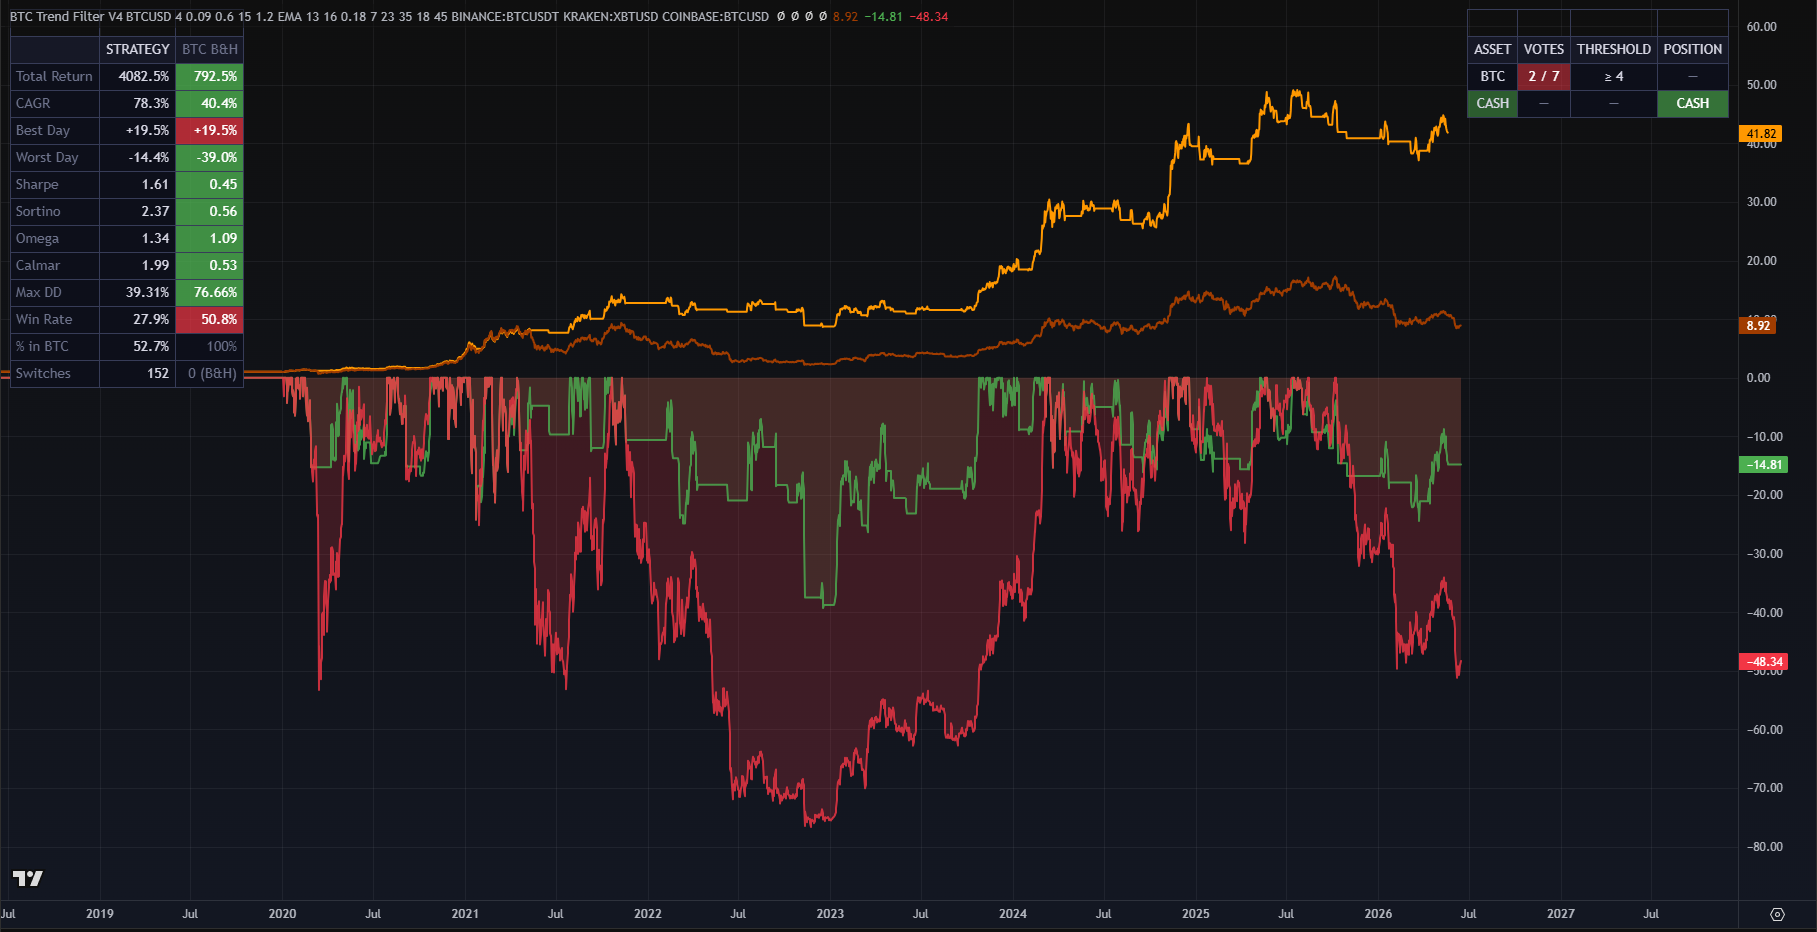
Drawdown comparison — strategy drawdown vs BTC buy-and-hold drawdown.
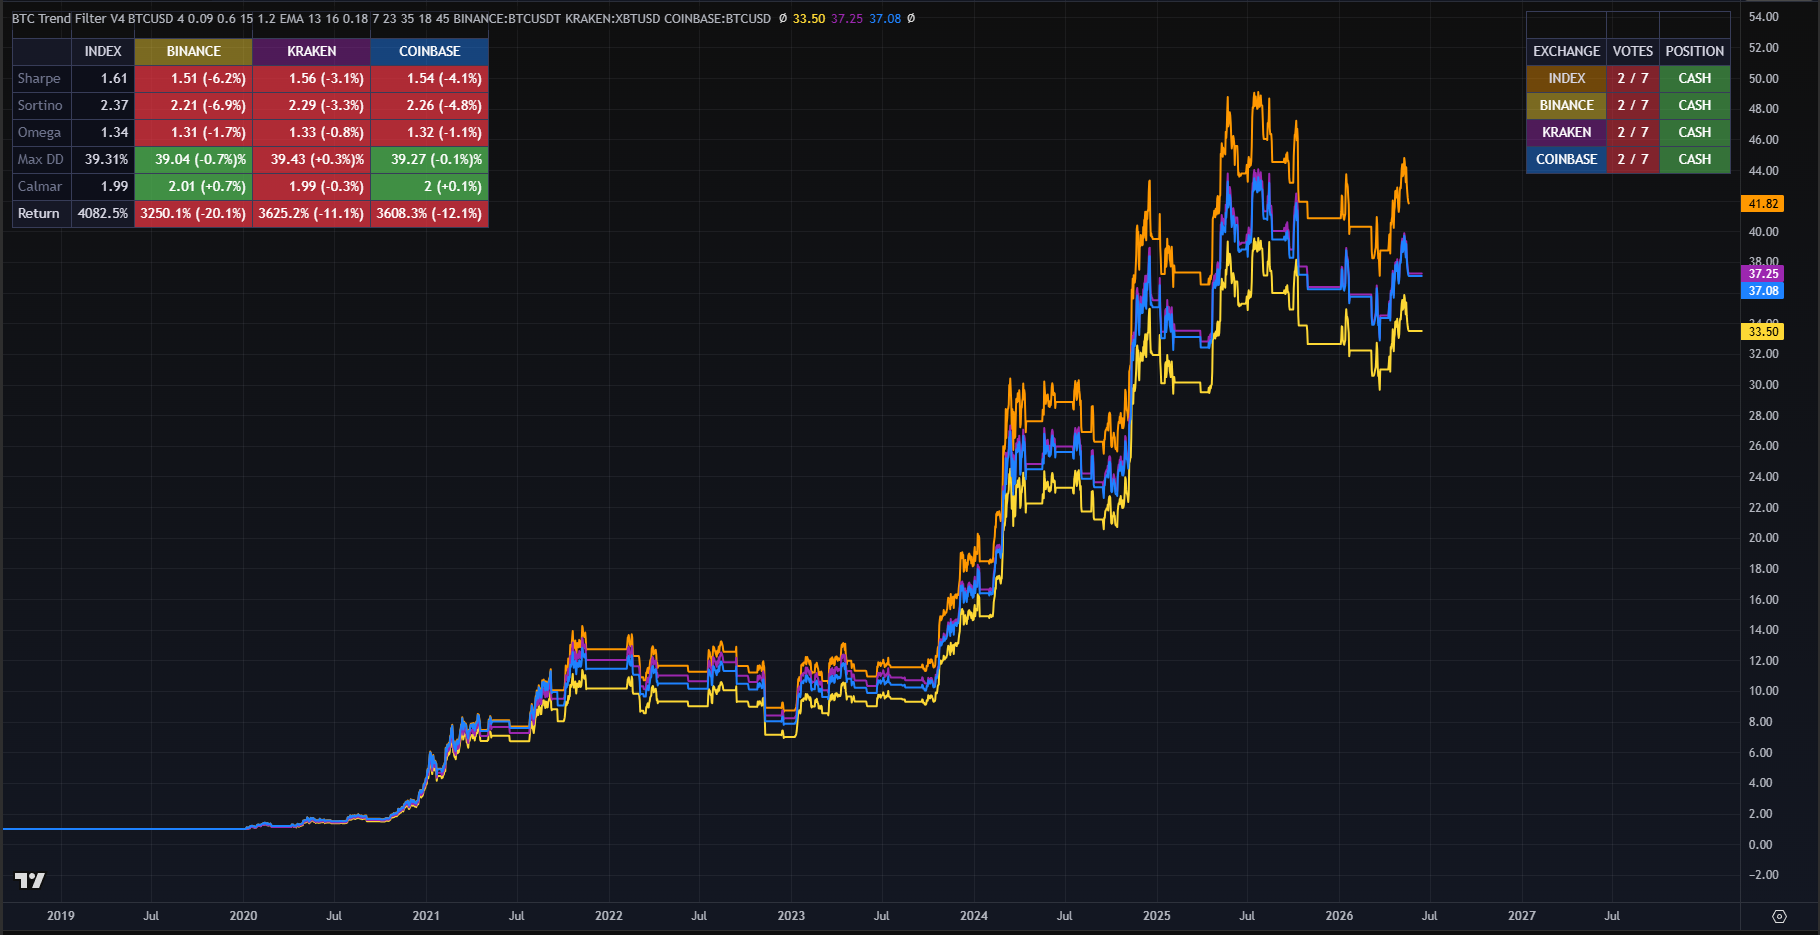
Multi-exchange validation — same parameters, 4 independent data feeds.
✓ Full risk metrics: Sharpe, Sortino, Omega, Calmar
✓ Plain-English methodology disclosure
How the system works
Seven independent indicators each cast a daily vote. If 4 or more agree — the system holds BTC.
If they don't — it steps aside into cash. No emotion, no guessing.
01
Seven indicators vote daily
Trend, oscillator, momentum, and rank-based algorithms each analyse the same price data from a different mathematical perspective.
02
Majority rules
4 out of 7 votes required to hold BTC. Not 1, not 2 — a genuine consensus. Noisy signals get outvoted before they cost you.
03
Daily close signal
Signal fires at daily close. No intraday noise, no constant checking. One clear instruction: hold BTC or hold cash.
The 7 indicators
Exact parameters are proprietary and provided to subscribers. The logic of each is fully disclosed in the robustness report.
#
Category
Logic
T1
Trend
Adaptive noise filtering to determine directional bias
Jan 2020 – Present. All metrics on daily close prices. Commission sensitivity tested separately in the robustness report.
Metric
Strategy
BTC Buy & Hold
Edge
Total Return
4,082.5%
792.5%
+3,290%
Annualised Return (CAGR)
78.3%
40.4%
+37.9%
Sharpe Ratio
1.61
0.45
+1.16
Sortino Ratio
2.37
0.56
+1.81
Omega Ratio
1.34
1.09
+0.25
Calmar Ratio
1.99
0.53
+1.46
Maximum Drawdown
39.31%
76.66%
−37.35%
Win Rate (daily)
27.9%
50.8%
—
% Time Holding BTC
52.7%
100%
—
Tested across 4 exchanges
Same parameters, four independent BTC price feeds. Results within a tight band across all four.
The signal is in the market — not in a single data source.
BTC Index
1.61
Sharpe (Reference)
Binance
1.51
Sharpe (−6.2%)
Kraken
1.56
Sharpe (−3.1%)
Coinbase
1.54
Sharpe (−4.1%)
Free Download
Not ready to subscribe yet?
Read the full 12-page robustness report first — methodology, backtest assumptions, exchange testing, and every performance figure explained. Free, no strings attached.
One plan. One price.
Everything you need to run the strategy. Cancel any time — no lock-in.
Enter your TradingView username and email, then checkout securely via Stripe. Access is granted within minutes.
Frequently asked questions
Is this live trading or backtested?
The performance figures in this report are backtested on historical data (Jan 2020–Present). Past performance is not a guarantee of future results. The full robustness report is transparent about assumptions, commissions, and limitations.
Do I need coding experience?
No. The Pine Script is ready to use on TradingView — just add it to your chart. No coding required. The indicator shows a simple signal: hold BTC or hold cash.
How do I get access after paying?
Once your payment is confirmed, I'll add your TradingView username to the invite-only script within minutes. You'll receive an email confirmation when it's done.
What timeframe does it run on?
Daily (1D) timeframe only. Signals fire at the daily close. This is not a scalping or intraday system — it's designed for systematic trend-following with a medium-to-long holding period.
Can I cancel my subscription?
Yes, cancel any time from your Stripe customer portal — no questions asked, no lock-in period. Access is removed at the end of your billing period.
Why a voting system instead of one indicator?
Single indicators generate false signals in noisy markets. A democratic system of 7 independent indicators means any one noisy signal gets outvoted. The result is fewer whipsaws and more reliable trend confirmation.
Risk Warning: All performance figures presented on this page are backtested results based on historical data.
Past performance is not indicative of future results. Backtested performance may differ materially from live trading results due to
factors including but not limited to market impact, slippage, liquidity, and parameter drift. This content is provided for
informational and educational purposes only and does not constitute financial advice or a recommendation to buy or sell any asset.
Cryptocurrency markets are highly volatile and speculative. You may lose some or all of your invested capital. Only risk capital you
can afford to lose entirely. RC-Tools is not a regulated financial advisor or broker.
Contact: support@rc-tools.com